Amazon CloudWatch
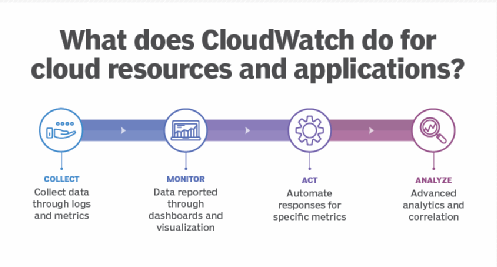
Amazon CloudWatch is a monitoring and management service
that provides data and actionable insights for AWS, hybrid, and on-premises
applications and infrastructure resources. CloudWatch enables real-time
monitoring of AWS resources such as Amazon Elastic Compute Cloud (EC2)
instances, Amazon Elastic Block Store (EBS) volumes, Elastic Load Balancing and
Amazon Relational Database Service (RDS) instances.
You can use
CloudWatch to collect and track metrics, which are variables you can measure
for your resources and applications.
The CloudWatch
home page automatically displays metrics about every AWS service you use. You
can additionally create custom dashboards to display metrics about your custom
applications, and display custom collections of metrics that you choose.
You can create
alarms that watch metrics and send notifications or automatically make changes
to the resources you are monitoring when a threshold is breached. For example,
you can monitor the CPU usage and disk reads and writes of your Amazon EC2 instances and then use that data to determine whether you should launch
additional instances to handle increased load. You can also use this data to
stop under-used instances to save money.
Ø
CloudWatch Work:
Amazon CloudWatch is basically a metrics repository. An
AWS service—such as Amazon EC2—puts metrics into the repository, and you
retrieve statistics based on those metrics. If you put your own custom metrics
into the repository, you can retrieve statistics on these metrics as well.
v Matrices:
Metrics are data about the
performance of your systems. By default, many services provide free metrics for
resources (such as Amazon EC2 instances, Amazon EBS volumes, and Amazon RDS DB
instances). You can also enable detailed monitoring for some resources, such as
your Amazon EC2 instances, or publish your own application metrics. Amazon
CloudWatch can load all the metrics in your account (both AWS resource metrics
and application metrics that you provide) for search, graphing, and alarms.
Metric data is kept for 15
months, enabling you to view both up-to-the-minute data and historical data.
User
can create metric alarm and composite alarms in Amazon
CloudWatch.
1. Matric Alarm- watches a single CloudWatch metric or the result of a math expression based on CloudWatch metrics. The alarm performs one or more actions based on the value of the metric or expression relative to a threshold over a number of time periods.
2. Composite Alarm- includes a rule expression that takes into account the alarm states of other alarms that you have created. The composite alarm goes into ALARM state only if all conditions of the rule are met. The alarms specified in a composite alarm's rule expression can include metric alarms and other composite alarms.
Using
composite alarms can reduce alarm noise. You can create multiple metric alarms,
and also create a composite alarm and set up alerts only for the composite
alarm. For example, a composite might go into ALARM state only when all of the
underlying metric alarms are in ALARM state.
Ø
Alarm states:
A metric
alarm has the following possible states:
1.
OK– The metric or expression is within the defined threshold.
2.
ALARM– The metric or expression is outside of the defined threshold.
3.
INSUFFICIENT_DATA– The alarm has just started, the metric is not available, or not enough data is available for the metric to determine the alarm state.
You can configure
CloudWatch Logs to send a notification whenever an alarm is triggered for
CloudTrail. Doing so enables you to respond quickly to critical operational
events captured in CloudTrail events and detected by CloudWatch Logs.
CloudWatch uses Amazon Simple Notification Service (SNS)
to send email.


0 Comments